1. 概述
我们在上一篇文章初识 Pandas中已经对 Pandas 作了一些基本介绍,本文我们进一步来学习 Pandas 的一些使用。
2. 缺失项
在现实中我们获取到的数据有时会存在缺失项问题,对于这样的数据,我们通常需要做一些基本处理,下面我们通过示例来看一下。
import numpy as np
from pandas import Series, DataFrame
s = Series(['1', '2', np.nan, '3'])
df = DataFrame([['1', '2'], ['3', np.nan], [np.nan, 4]])
print(s)
print(df)
#  清除缺失项
print(s.dropna())
print(df.dropna())
# 填充缺失项
print(df.fillna('9'))
print(df.fillna({
     0:'5', 1:'6'}))
3. 分组聚合
我们通过示例来了解一下分组、聚合操作。
from pandas import DataFrame
df = DataFrame({
     'name':['张三', '李四', '王五', '赵六'],
                'gender':['男', '女', '男', '女'],
                'age':[22, 11, 22, 33]})
# 根据 age 分组
gp1 = df.groupby('age')
# 根据 age、gender 分组
gp2 = df.groupby(['age', 'gender'])
# 根据 gender 进行分组,将 name 作为分组的键
gp3 = df['gender'].groupby(df['name'])
# 查看分组
print(gp2.groups)
# 分组数量
print(gp2.count())
# 选择分组
print(gp2.get_group((22, '男')))
print('---------')
# 聚合
gp4 = df.groupby(df['gender'])
# 和
print(gp4.sum())
# 平均值
print(gp4.mean())
# 最大值
print(gp4.max())
# 最小值
print(gp4.min())
# 同时做多个聚合运算
print(gp4.agg(['sum', 'mean']))
4. 数据合并
Pandas 具有高性能内存中连接操作,与 SQL 相似,它提供了 merge() 函数作为 DataFrame 对象之间连接操作的入口,我们通过示例来看一下。
from pandas import DataFrame
import pandas as pd
df1 = DataFrame({
     'A':[2, 4, 5], 'B':[1, 2, 3], 'C':[2, 3, 6]})
df2 = DataFrame({
     'D':[1, 3, 6], 'E':[2, 5, 7], 'F':[3, 6, 8]})
df3 = DataFrame({
     'G':[2, 3, 6], 'H':[3, 5, 7], 'I':[4, 6, 8]})
df4 = DataFrame({
     'G':[1, 3, 5], 'H':[4, 6, 8], 'I':[5, 7, 9]})
# 左连接(以 d1 为基础)
print(df1.join(df2, how='left'))
# 右连接
print(df1.join(df2, how='right'))
# 外连接
print(df1.join(df2, how='outer'))
# 合并多个 DataFrame
print(df3.join([df1, df2]))
# 指定列名进行合并
print(pd.merge(df3, df4, on='G'))
print(pd.merge(df3, df4, on=['G', 'H']))
print(pd.merge(df3, df4, how='left'))
print(pd.merge(df3, df4, how='right'))
print(pd.merge(df3, df4, how='outer'))
5. 数据可视化
Pandas 的 Series 和 DataFrame 的绘图功能是包装了 matplotlib 库的 plot() 方法实现的,下面我们通过示例来看一下。
5.1 折线图
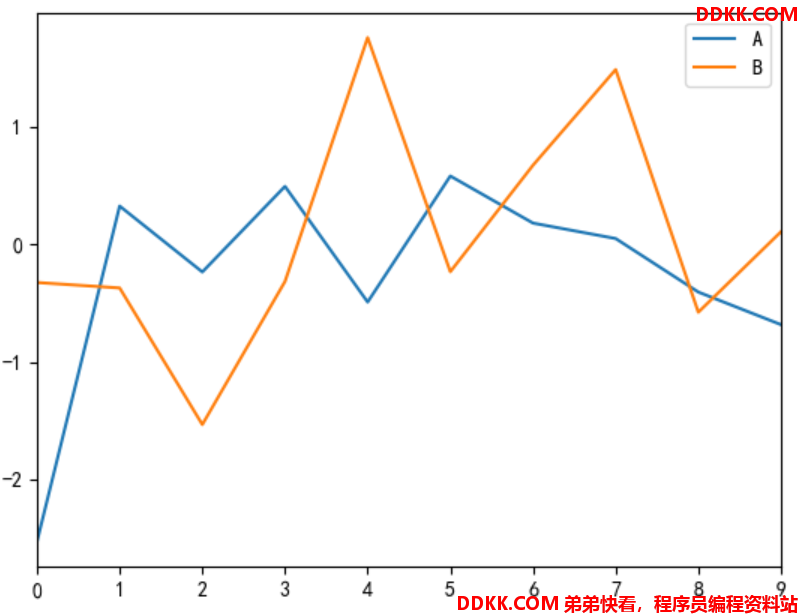
折线图代码实现如下所示:
import pandas as pd, numpy as np, matplotlib.pyplot as plt
df = pd.DataFrame(np.random.randn(10,2), columns=list('AB'))
df.plot()
plt.show()
看一下效果:
5.2 条形图
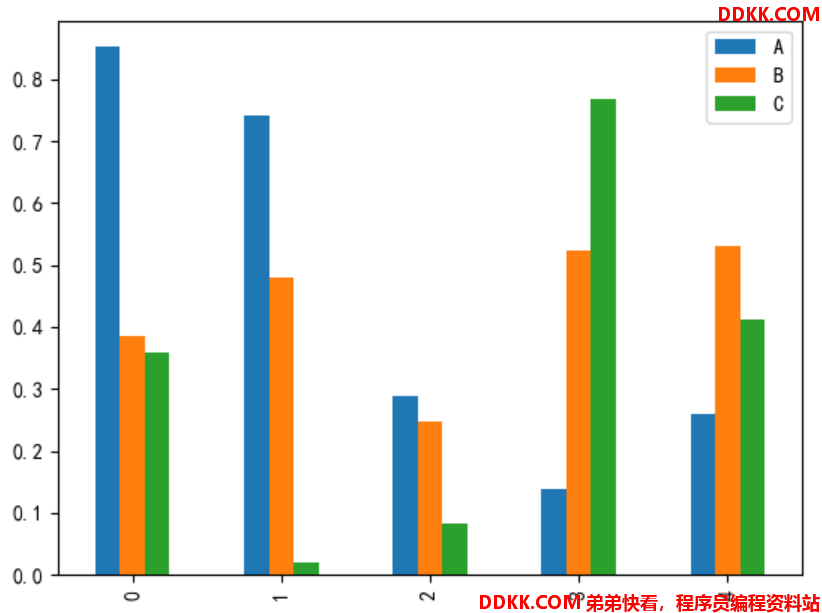
纵置条形图代码实现如下所示:
import pandas as pd, numpy as np, matplotlib.pyplot as plt
df = pd.DataFrame(np.random.rand(5,3), columns=list('ABC'))
df.plot.bar()
plt.show()
看一下效果:
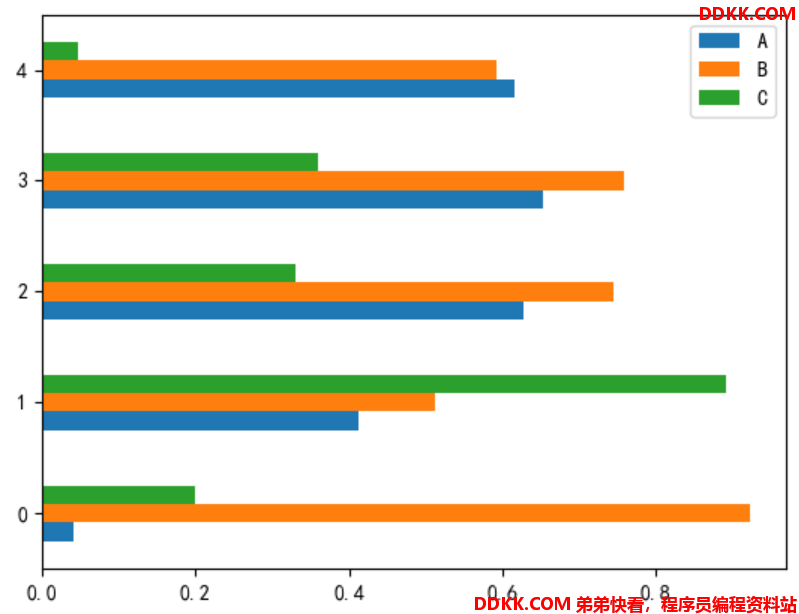
横置条形图代码实现如下所示:
import pandas as pd, numpy as np, matplotlib.pyplot as plt
df = pd.DataFrame(np.random.rand(5,3), columns=list('ABC'))
df.plot.barh()
plt.show()
看一下效果:
5.3 直方图
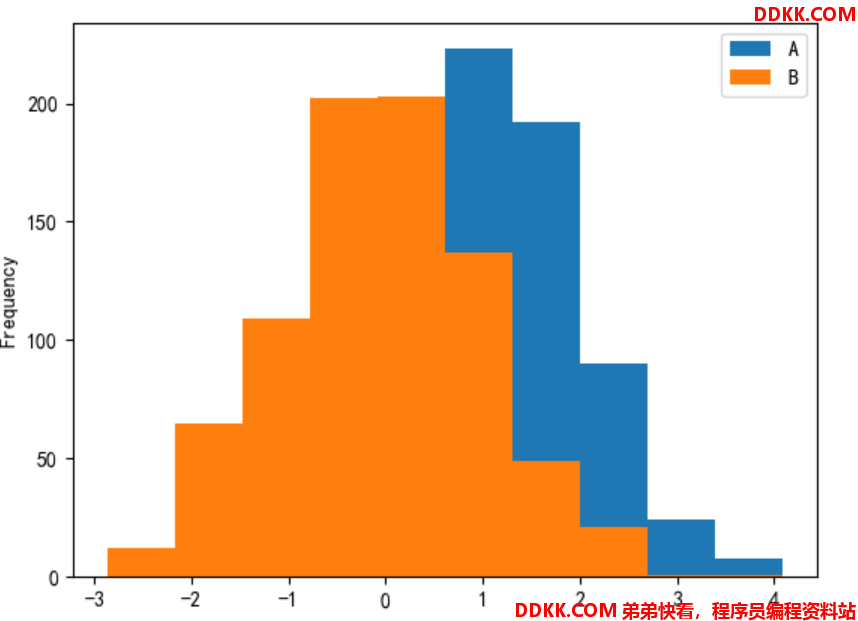
直方图代码实现如下所示:
import pandas as pd, numpy as np, matplotlib.pyplot as plt
df = pd.DataFrame({
     'A':np.random.randn(800)+1, 'B':np.random.randn(800)}, columns=list('AB'))
df.plot.hist(bins=10)
plt.show()
看一下效果:
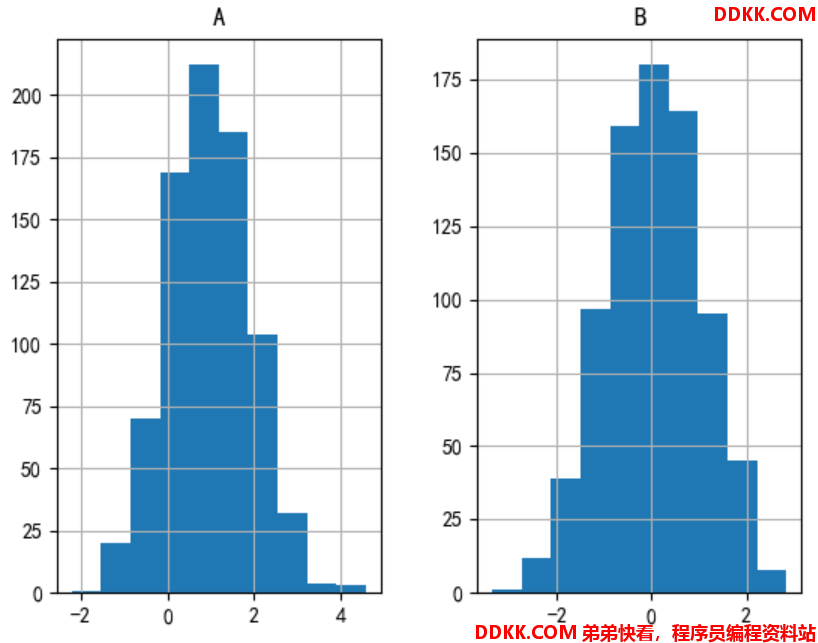
我们还可以将 A、B 分开显示,代码实现如下:
import pandas as pd, numpy as np, matplotlib.pyplot as plt
df = pd.DataFrame({
     'A':np.random.randn(800)+1, 'B':np.random.randn(800)}, columns=list('AB'))
df.hist(bins=10)
plt.show()
看一下效果:
5.4 散点图
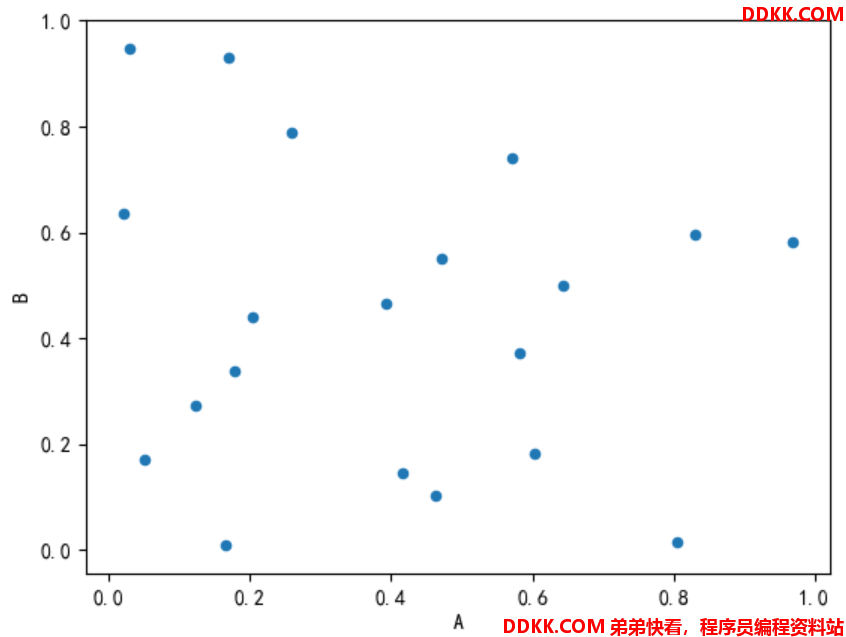
散点图代码实现如下所示:
import pandas as pd, numpy as np, matplotlib.pyplot as plt
df = pd.DataFrame(np.random.rand(20, 2), columns=list('AB'))
df.plot.scatter(x='A', y='B')
plt.show()
看一下效果:
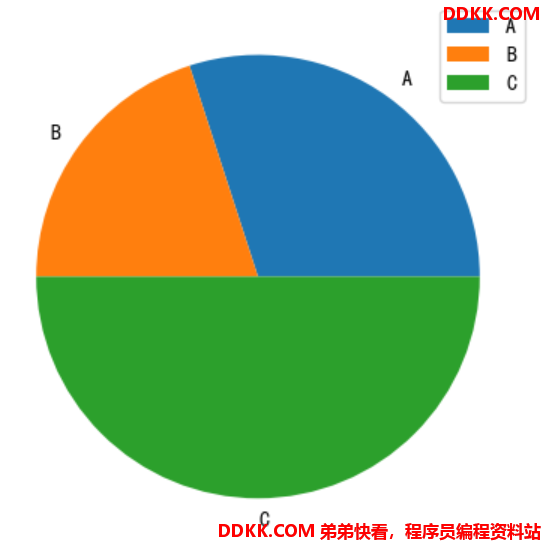
5.5 饼图
饼图代码实现如下所示:
import pandas as pd, numpy as np, matplotlib.pyplot as plt
df = pd.DataFrame([30, 20, 50], index=list('ABC'), columns=[''])
df.plot.pie(subplots=True)
plt.show()
看一下效果:
